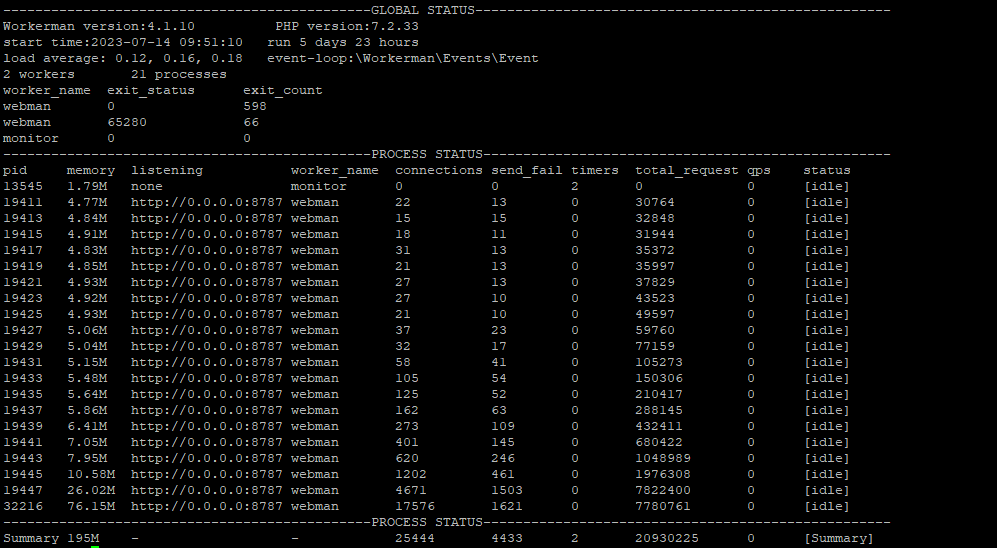
在 9 点 32 分的时候通过php start.php status看 total_request 是 20930225.然后到了 9 点 45 分时再次通过php start.php status看 total_request 是 13360680 ,怎么请求量反而变少了?
附上图片:
9 点 32 的截图:
9 点 45 分的截图:
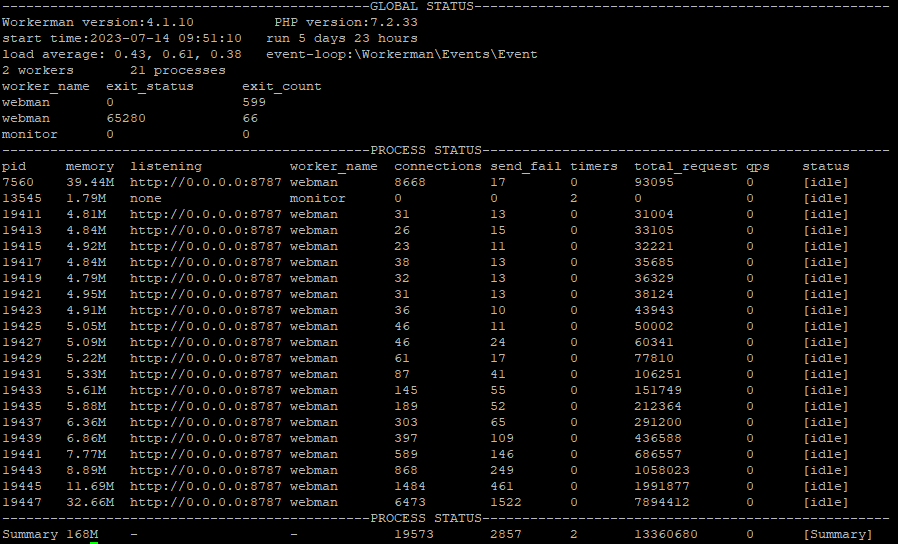
问题 2:
在 9 点 45 分的状态图中,发现有一个连接数最多的 webman 进程的 pid 是 4 位数的,而 9 点 32 分时看所有进程的 pid 都是 5 位数的,这个是什么原因造成的?